Customer Support Analytics for Managers: Metrics and AI Tools

Customer support analytics is the practice of turning raw interaction data (tickets, chats, calls, surveys) into decisions that change how a support team operates. The first move: pick one to three KPIs tied to an actual business goal, confirm you can trust the data feeding them, and run a short test window before rolling anything out wider.
Support data comes from more places than most teams realize. You’ve got ticket systems, chat transcripts, call recordings, post-interaction surveys, and CRM events, and each one captures a different slice of the player or customer experience.
- Tickets and case notes: volume, category, resolution path
- Chat and call transcripts: language, sentiment, escalation triggers
- Surveys: CSAT, NPS, CES scores tied to specific interactions
- CRM events: account history, prior contacts, lifetime value signals
Pro Tip: Don’t chase a single number in isolation. Shaving down Average Handle Time while First Contact Resolution quietly drops just moves the pain to a second ticket. Track both together.
Key Takeaways
Customer support analytics turns interaction data into specific operational decisions, and it works best when a small set of KPIs are tied to a stated business goal and checked by a human before automation runs unsupervised.
| Point | Details |
|---|---|
| Start with one to three KPIs | Pick metrics tied to a real business goal before building any dashboard. |
| Pair leading and lagging metrics | Combine a lagging indicator like AHT with a leading one like sentiment trend. |
| Use the four analytics types | Descriptive, diagnostic, predictive, and prescriptive analysis each answer a different question. |
| Fix data quality before scaling | Inconsistent identifiers and taxonomy drift break every downstream calculation. |
| Agentria pairs AI drafts with human review | Staff approval is configurable per brand, from sign off on every reply to auto sending only high-confidence drafts, with a full audit trail behind both. |
Table of Contents
- What Customer Support Analytics Covers (and How It’s Different)
- The Four Main Types of Support Analytics
- Core Metrics Every Support Team Should Track
- Where Support Analytics Actually Pays Off
- How AI Changes the Analytics Job (and Where Humans Still Matter)
- Getting Started: A Practical Rollout Checklist
- Choosing Which Metrics Actually Deserve Priority
- A Realistic Implementation Timeline
- Where Teams Get Stuck (and How to Avoid It)
- What to Look For in a Support Analytics Platform
- Turning Analytics Into Real Improvement Projects
- Bring Analytics and AI Support Together With Agentria
- Frequently Asked Questions
- Sources
What Customer Support Analytics Covers (and How It’s Different)
Support analytics looks at what happens inside individual interactions across phone, chat, email, social, and in-app messaging. That’s a different job than sales or finance analytics, which mostly track outcomes (revenue, close rate) without caring how the conversation got there.
Two data types matter here. Quantitative inputs are timestamps, volumes, and durations. Qualitative inputs are transcripts, free-text survey comments, and sentiment signals extracted from language itself. Salesforce’s breakdown of customer service analytics frames this well: the goal is combining structured metrics like First Response Time with unstructured signals like what a player actually typed.
The operational focus sits lower than corporate dashboards usually go. You’re checking SLA adherence by shift, agent-level performance gaps, and root causes behind recurring ticket spikes. Before any of that works, confirm you can integrate:
- The ticketing or helpdesk platform
- Telephony or call recording system
- Live chat and messaging channels
- CRM records for account context
- Post-interaction survey tools
The Four Main Types of Support Analytics
Descriptive analytics answers “what happened.” Think ticket volume by day, channel mix, or a spike in Monday morning contacts. It’s the baseline every team starts with, and it’s usually the easiest data to pull.
Diagnostic analytics answers “why.” This is where you correlate fields, cross-referencing a surge in billing tickets against a recent price change or app update. Sprinklr’s taxonomy of customer service analytics treats this stage as the one that actually reveals root causes rather than symptoms.
Predictive analytics answers “what’s likely next.” Churn-risk scoring, staffing forecasts based on seasonal contact patterns, and anomaly detection all live here.
Prescriptive analytics answers “what should we do.” Next-best-action recommendations, automated routing rules, and suggested replies fall in this bucket.
Beyond these four, most teams also lean on a few specialized lenses:
- Conversation/interaction analytics: mining transcripts at scale for themes and sentiment
- Journey analytics: tracking a customer across multiple touchpoints and channels
- Retention/voice-of-customer analytics: connecting support signals to renewal and lifetime value
Descriptive dashboards tell you the ticket queue is growing. Diagnostic analysis tells you it’s growing because a broken deposit flow is generating three tickets per affected player. That distinction is the entire reason teams invest in analytics beyond a basic report.
Core Metrics Every Support Team Should Track
Some metrics tell you what already happened (lagging indicators). Others hint at what’s coming (leading indicators). Pair one from each category or you’ll always be reacting a week late.
Operational KPIs:
| Metric | Formula / Definition | Common Pitfall |
|---|---|---|
| First Response Time (FRT) | Time from ticket creation to first agent reply | Skewed by after-hours tickets if not segmented by shift |
| Average Handle Time (AHT) | Total handle time ÷ number of interactions | Optimizing this alone can hurt resolution quality |
| First Contact Resolution (FCR) | Resolved-on-first-contact tickets ÷ total tickets | Definitions vary; lock down what counts as “resolved” |
| Resolution Rate | Closed tickets ÷ total tickets in period | Doesn’t account for reopened tickets unless tracked separately |
| SLA Compliance | Tickets meeting SLA target ÷ total tickets | Static SLA targets ignore seasonal volume swings |
| Ticket Volume | Raw count by channel, category, time period | Meaningless without a per-agent or per-capita baseline |
Experience and business KPIs:
- CSAT: percentage of respondents rating an interaction positively, usually sampled from a small fraction of closed tickets, which introduces sampling bias if response rates run low
- NPS: measures likelihood to recommend on a 0 to 10 scale, useful for relationship-level sentiment rather than single-ticket quality
- Customer Effort Score (CES): how much effort a customer felt they spent resolving their issue
- Churn risk indicators: composite scores blending contact frequency, sentiment trend, and product usage drop-off
- Customer Lifetime Value (CLV) as it relates to support: connecting support cost and experience quality to retention value
FRT and AHT are lagging; ticket volume trend and sentiment trajectory are more leading. Salesforce lists FRT, AHT, CSAT, NPS, and Resolution Rate as the core five most teams start with, and that’s a reasonable starting shortlist if you’re building your first dashboard.
Where Support Analytics Actually Pays Off
Real-time monitoring and smart routing cut SLA breaches before they happen, not after. A dashboard that flags a queue approaching its SLA threshold lets a supervisor reroute tickets or add headcount in the moment rather than explaining a miss the next morning.

Voice-of-customer signals feed product teams directly. When a spike in “can’t withdraw funds” tickets ties back to a specific app version, that’s a defect report product managers can act on immediately, and it usually reduces the same ticket category within one or two release cycles.
Auto-QA changes coaching entirely. Instead of a supervisor manually reviewing 2% of calls, sentiment and compliance scoring can run against every conversation. Talkdesk’s interaction analytics documentation describes analyzing 100% of conversations across voice, chat, and digital channels to surface friction points and coaching opportunities that sampling would miss entirely.
Churn-risk models let teams intervene before a cancellation, not after.
When 100% of interactions get scored instead of a random 2% sample, the coaching conversation shifts from “here’s one call that went badly” to “here’s a pattern across forty of your calls this month.” That’s a fundamentally different kind of feedback for an agent.
Planning target: teams that pair auto-QA with targeted coaching commonly report measurable AHT reductions and CSAT gains within a quarter, though the size of that gain depends heavily on how noisy your baseline data was going in.
How AI Changes the Analytics Job (and Where Humans Still Matter)
AI now handles the grunt work that used to make full-coverage analysis impossible: automatic topic tagging, sentiment scoring, anomaly detection, and even draft replies generated from context. That’s the shift from sampling a fraction of interactions to reviewing all of them, and it’s the single biggest capability jump support analytics has seen in years.

But capability isn’t the same as license to automate blindly. In regulated verticals like iGaming, an AI-drafted reply touching a withdrawal dispute or a responsible-gambling flag needs a human set of eyes before it reaches a player. Agentria builds its platform around exactly this tension: multiple AI providers generate candidate responses, and you decide how many of them a human sees before they send.
That human-in-the-loop step isn’t just a quality gate. It creates an audit trail regulators and internal compliance teams can actually reconstruct after the fact, which matters enormously when a dispute gets escalated months later.
Speed and compliance usually get treated as opposing goals. The workable version pairs AI-generated drafts with fast human review, so response time drops without ever removing accountability from the final message.
Pro Tip: Stage any new AI model on a slice of live traffic in parallel, watching its suggestions without letting them ship automatically, before trusting it on real player conversations.
Getting Started: A Practical Rollout Checklist
Start with an audit, not a tool purchase. Map every existing data source and agree on canonical identifiers, the same user ID and ticket ID structure across your ticketing system, telephony platform, and CRM, so a “customer” in one system is unmistakably the same customer in another.
Phase 0: Audit and map. Inventory data sources; confirm identifiers align across systems.
Phase 1: Pick your KPIs. Choose one to three metrics tied to a specific outcome (lower AHT, higher CSAT, fewer repeat contacts), then check whether the underlying data is actually clean enough to trust.
Phase 2: Wire up integrations. Connect ticketing, telephony, chat, CRM, and survey tools. Build dashboards and set alert thresholds so issues surface before a weekly report catches them.
Phase 3: Run a short experiment. Six to eight weeks is usually enough to see whether a taxonomy or model change is actually moving the metric you picked, and short enough that stakeholders don’t lose patience waiting for results.
Executive buy-in tends to follow, not precede, a clean first result. That said, Gartner has found that customer data and analytics rank among the top priorities for service and support leaders trying to hit their goals, which is worth citing directly when you’re asking for budget or integration resources.
- Audit data sources and identifiers before touching a tool
- Lock in one to three KPIs tied to a stated business outcome
- Build dashboards with alert thresholds, not static weekly exports
- Time-box the first experiment to six to eight weeks
Choosing Which Metrics Actually Deserve Priority
Not every KPI on your dashboard deserves equal attention, and treating them that way is how teams end up drowning in reports nobody reads. Start from the business goal, not the metric list. If leadership’s priority this quarter is reducing churn, your top metrics are churn-risk indicators and CSAT trend by cohort, not raw ticket volume.
Weight metrics by financial exposure. A support queue tied to VIP account handling or payment disputes deserves tighter monitoring than a general FAQ channel, even if the FAQ channel generates more total tickets. Volume alone is a poor proxy for importance.
Separate diagnostic metrics from headline metrics. AHT and FCR are useful for understanding why CSAT moved, but they shouldn’t compete with CSAT for executive attention. Keep a two-tier structure: a small set of outcome metrics that leadership sees, and a broader set of diagnostic metrics your analysts used to explain movement in those outcomes.
Revisit priorities on a fixed cadence, quarterly works for most teams, rather than letting the same five KPIs run unquestioned for years. Business goals shift; a metric set built around last year’s priority (say, ticket deflection) may actively mislead you if this year’s priority is retention.
Finally, weigh implementation cost against expected impact. A churn-risk model requires clean historical data and modeling effort; a simple SLA-breach alert requires almost none. Sequence the low-cost, high-impact items first, and save the heavier lifts for once your data foundation is solid enough to support them.
A Realistic Implementation Timeline
Most teams underestimate how long clean data takes and overestimate how long model-building takes. A realistic sequence spreads over roughly four to six months for a mid-market operation, longer for enterprise environments with more legacy systems to untangle.
Weeks 1 to 3: Discovery and audit. Map every data source, identify gaps in identifier consistency, and agree on which one to three KPIs matter most for this cycle.
Weeks 4 to 8: Integration build-out. Connect ticketing, telephony, chat, and CRM systems into a unified reporting layer. This phase usually takes longer than planned because legacy systems rarely export data in a clean, consistent format.
Weeks 9 to 12: Dashboard and alerting. Build the actual dashboards, set SLA and anomaly alert thresholds, and get supervisors trained on reading them daily rather than weekly.
Weeks 13 to 20: Pilot and experiment. Run your first six to eight week measurement window against a real intervention, whether that’s a new routing rule, a coaching program built on auto-QA scores, or a churn-risk outreach workflow.
Weeks 21 to 26: Review and scale. Assess what moved, refine the taxonomy or model based on what the pilot revealed, and expand successful interventions to additional teams or channels.
Treat this as a rolling cycle, not a one-time project. Each pilot should feed directly into the next quarter’s priority list.
Where Teams Get Stuck (and How to Avoid It)
The most common failure point isn’t a lack of tools. It’s dirty, inconsistent data. If your ticket system logs a “resolved” ticket differently than your chat platform does, every FCR calculation downstream is comparing apples to oranges without anyone noticing until the numbers stop making sense.
Taxonomy drift is a close second. Categories and tags that made sense a year ago (say, “billing issue”) often need to split into finer buckets (“failed deposit,” “disputed charge,” “refund request”) as volume grows, and teams that never revisit their tagging structure end up with a category so broad it stops being diagnostic.
Vanity metrics creep in when a dashboard gets built for its own sake rather than a business question. Tracking ticket volume without a per-agent baseline, or CSAT without controlling for response rate, produces numbers that look authoritative but don’t actually tell you what to do next.
Over-automation without review is the newest risk, and the sharpest one in regulated industries. An AI model that drafts a reply automatically and sends it without any human check can move fast and still create a compliance problem the moment it touches a sensitive case type.
Mitigation is mostly discipline: lock definitions in writing before building dashboards, revisit taxonomy on a fixed schedule, tie every metric to a stated business question before it earns a spot on a leadership report, and require human review for any AI-generated response in a regulated or high-stakes category.
What to Look For in a Support Analytics Platform
Evaluate a platform on five things: how it handles your specific data sources, how much of the analysis AI actually automates versus how much still requires manual tagging, how easy the deployment and integration work will be for your team, what governance controls it offers, and what it actually costs to run at your ticket volume.
Zendesk built its analytics suite as an extension of its widely used helpdesk, which makes it a natural fit for teams already running their ticketing through the platform, since reporting draws directly from data that’s already structured and clean. The tradeoff is that deeper AI-driven interaction analysis, the kind that mines full transcripts for sentiment and root cause, tends to require add-on modules rather than coming built in.
SupportLogic leans heavily into predictive signal detection, flagging tickets likely to escalate or churn before an agent even responds, which suits enterprise teams with high ticket volume and dedicated analyst headcount to act on those signals.
SentiSum focuses specifically on automated topic tagging and root-cause categorization across support conversations, aiming to replace manual tagging entirely with AI classification, a strong fit for teams whose biggest pain point is inconsistent, human-applied ticket tags.
Whichever category you’re evaluating, weigh deployment overhead against your team’s actual analyst capacity. A platform with powerful predictive modeling is wasted if nobody has time to act on the risk scores it generates.
Turning Analytics Into Real Improvement Projects
An insight only matters if it turns into a specific initiative with an owner and a deadline. “CSAT dropped 8 points on billing tickets last month” is an observation. “Billing agents need a refresher on the new refund policy by next Friday, tracked via a follow-up CSAT check” is an initiative.
A spike in repeat contacts within 24 hours on a specific issue category usually means the first response didn’t actually solve the problem, even though it got marked resolved. The fix isn’t more agent training in general. It’s reviewing the specific resolution scripts or macros used for that ticket category and correcting the guidance those agents were given.
Sentiment analysis showing a negative trend concentrated in one channel, say, live chat but not email, often points to a channel-specific gap: maybe chat agents are handling a higher proportion of urgent issues, or a bot handoff is frustrating customers before a human ever joins.
Churn-risk scores that spike after a specific interaction type (a denied refund, a delayed VIP response) translate directly into a targeted retention workflow: proactive outreach within 48 hours, routed to a senior agent, before the customer disengages entirely.
The discipline that separates useful analytics from a dashboard nobody opens is this: every insight gets logged with a proposed action, an owner, and a follow-up metric that proves whether the action actually worked.
A Manager’s Take on Getting This Right
Start smaller than feels comfortable: one metric, one channel, one honest measurement window. Pair every AI-generated insight or reply with human review before it reaches a customer, especially in regulated categories where a wrong answer creates real exposure. Judge success by outcomes that matter to the business, not the metric that’s easiest to report. And keep the audit trail intact. When something goes wrong six months later, you’ll want a record of exactly who reviewed what.
Bring Analytics and AI Support Together With Agentria
Agentria gives online casino and iGaming operators something most support stacks can’t: AI-drafted replies across email, live chat, SMS, and Telegram, a review gate you set per brand, and a full audit trail behind each decision.
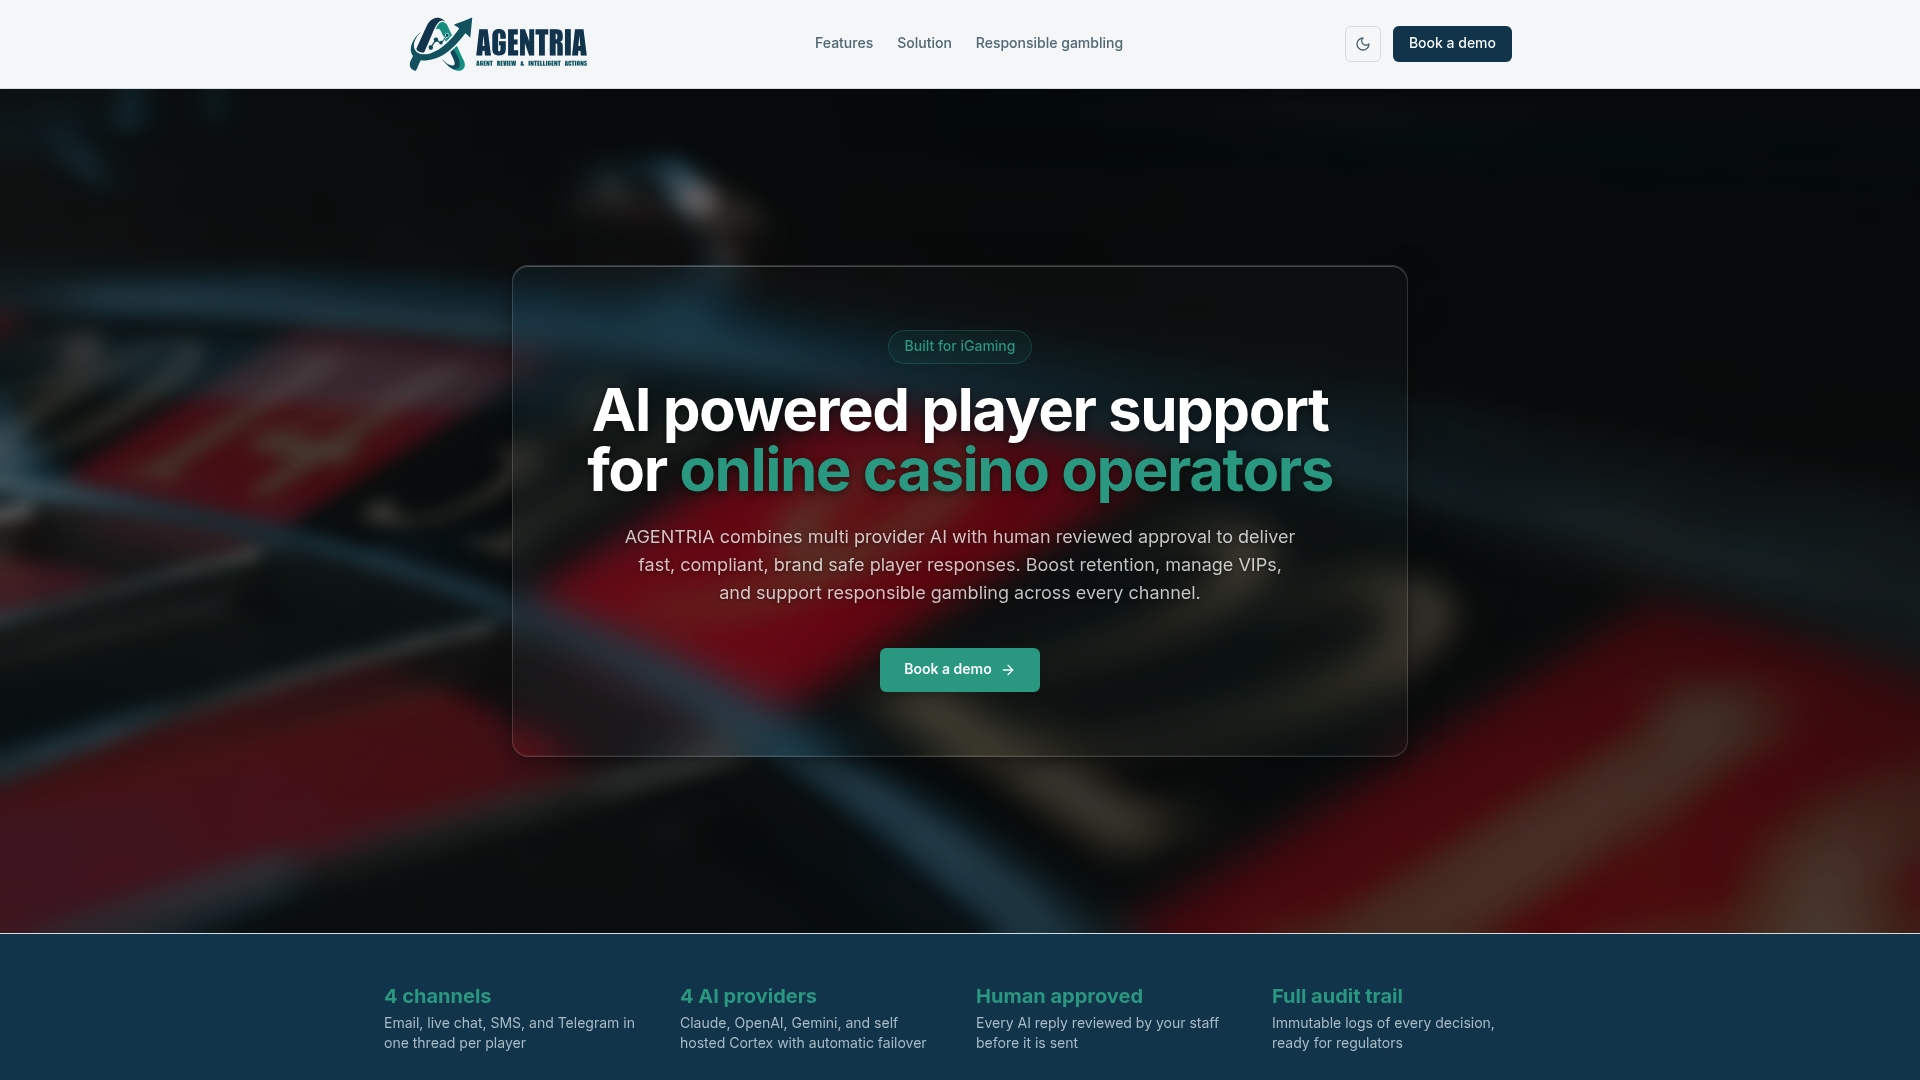
That combination solves the exact tension this article has walked through: AI’s ability to analyze and respond at scale, without losing the compliance oversight regulated operators can’t skip. Agentria’s support platform for online casino operators also carries each player’s VIP tier into the reply and detects responsible gambling signals, so sentiment and risk signals feed directly into action rather than sitting in a report nobody opens. If your team is trying to move from reactive ticket-watching to a system that flags risk, drafts responses, and keeps a defensible record of every decision, book a demo and see how it fits your current stack.
Frequently Asked Questions
What’s the difference between customer support analytics and customer service reporting? Reporting typically summarizes what happened over a period; analytics digs into why it happened and predicts what’s likely next. A weekly ticket volume report is reporting. A model flagging which tickets are likely to escalate is analytics.
Which KPI should a new support analytics program track first? Pick whichever metric ties most directly to a current business priority, often First Contact Resolution or CSAT, and confirm the underlying data is clean before trusting the number.
Do small support teams need AI-driven analytics, or is that only for enterprise operations? Even small teams benefit from automated sentiment tagging and topic categorization once manual review of every ticket becomes impractical, which tends to happen well before headcount reaches enterprise scale.
How does customer support analytics apply specifically to online casino and iGaming operators? Regulated gaming operators need the same operational metrics as any support team, plus responsible gambling detection, VIP handling speed, and a compliance-ready audit trail for every AI-assisted interaction.
How long does it take to see measurable results from a new analytics rollout? A focused six to eight week experiment window is usually enough to tell whether a specific change, a new routing rule or coaching program, is actually moving the metric you targeted.
Sources
- Customer Service Analytics: Understanding Your Data | Salesforce
- Gartner press release: Customer data and analytics top priority for customer service and support goals
- Customer Service Analytics 7 Types + Top Metrics | Sprinklr
- Customer Experience Analytics Software | Talkdesk
Recommended
See AGENTRIA on your support workflow
Book a walkthrough tailored to your brands, channels, and compliance requirements.